Weather Alert in Arizona
Flood Watch issued September 3 at 10:05AM MST until September 6 at 5:00PM MST by NWS Tucson AZ
AREAS AFFECTED: Upper Santa Cruz River and Altar Valleys including Nogales; Tucson Metro Area including Tucson/Green Valley/Marana/Vail; Southeast Pinal County including Kearny/Mammoth/Oracle; Upper San Pedro River Valley including Sierra Vista/Benson; Eastern Cochise County Below 5000 Feet including Douglas/Willcox; Upper Gila River and Aravaipa Valleys including Clifton/Safford; White Mountains of Graham and Greenlee Counties including Hannagan Meadow; Galiuro and Pinaleno Mountains including Mount Graham; Chiricahua Mountains including Chiricahua National Monument; Dragoon/Mule/Huachuca and Santa Rita Mountains including Bisbee/Canelo Hills/Madera Canyon; Santa Catalina and Rincon Mountains including Mount Lemmon/Summerhaven
DESCRIPTION: * WHAT...Flash flooding caused by excessive rainfall is possible. * WHERE...A portion of Southeast Arizona, including the following areas, Catalina and Rincon Mountains, Chiricahua Mountains, Dragoon and Mule and Huachuca and Santa Rita Mountains, Eastern Cochise County below 5000 feet, Galiuro and Pinaleno Mountains, Southeast Pinal County, Tucson Metro Area, Upper Gila River Valley, Upper San Pedro River Valley, Upper Santa Cruz River Valley/Altar Valley and White Mountains of Graham and Greenlee Counties. * WHEN...From Friday afternoon through Saturday afternoon. * IMPACTS...Excessive runoff may result in flooding of rivers, creeks, streams, and other low-lying and flood-prone locations. Flooding may occur in poor drainage and urban areas. Low-water crossings may be flooded. * ADDITIONAL DETAILS... - Moisture associated with Hurricane Lorena may bring periods of heavy rain to portions of southeast Arizona. Rainfall amounts of 1 to 2 inches with up to 4 inches in the mountains are possible. - http://www.weather.gov/safety/flood
INSTRUCTION: You should monitor later forecasts and be prepared to take action should Flash Flood Warnings be issued.
Want more detail? Get the Complete 7 Day and Night Detailed Forecast!
Current U.S. National Radar--Current
The Current National Weather Radar is shown below with a UTC Time (subtract 5 hours from UTC to get Eastern Time).

National Weather Forecast--Current
The Current National Weather Forecast and National Weather Map are shown below.

National Weather Forecast for Tomorrow
Tomorrow National Weather Forecast and Tomorrow National Weather Map are show below.

North America Water Vapor (Moisture)
This map shows recent moisture content over North America. Bright and colored areas show high moisture (ie, clouds); brown indicates very little moisture present; black indicates no moisture.

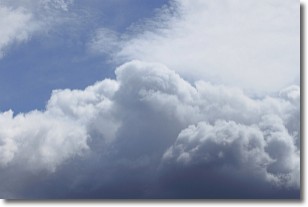
Weather Topic: What are Nimbostratus Clouds?
Home - Education - Cloud Types - Nimbostratus Clouds
 Next Topic: Precipitation
A nimbostratus cloud is similar to a stratus cloud in its formless,
smooth appearance. However, a nimbostratus cloud is darker than a stratus cloud,
because it is thicker.
Unlike a stratus cloud, a nimbostratus cloud typically brings with it the threat
of moderate to heavy precipitation. In some cases, the precipitation may evaporate
before reaching the ground, a phenomenon known as virga.
Next Topic: Precipitation
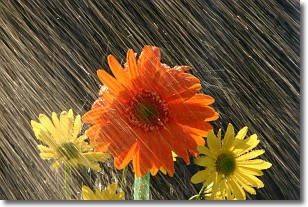
Weather Topic: What is Rain?
Home - Education - Precipitation - Rain
 Next Topic: Shelf Clouds
Precipitation in the form of water droplets is called rain.
Rain generally has a tendency to fall with less intensity over a greater period
of time, and when rainfall is more severe it is usually less sustained.
Rain is the most common form of precipitation and happens with greater frequency
depending on the season and regional influences. Cities have been shown to have
an observable effect on rainfall, due to an effect called the urban heat island.
Compared to upwind, monthly rainfall between twenty and forty miles downwind of
cities is 30% greater.
Next Topic: Shelf Clouds
Current conditions powered by WeatherAPI.com